Background
Cardiovascular diseases are a leading cause of death worldwide, and a deeper understanding of how blood flows is crucial for predicting and preventing them. Although modeling blood flow is crucial to this aim, many studies model blood as a simple fluid, like water. In reality, blood is a complex suspension of cells with unique mechanical properties. The properties of red blood cells (RBCs), which make up nearly half of blood volume, are essential for modeling blood flow accurately.
Although the elastic properties of the RBC membrane are well documented, less is known about the viscosity (η) of their cytosol. For simplicity, early studies assumed it was equal to that of blood plasma, setting the viscosity ratio λ = η/ηplasma to 1. This estimate was later revised to around λ = 5 in subsequent work. More recent comparisons between experimental findings and simulations indicate even higher values. One explanation for this range in values may be that RBCs undergo physical changes over their 120-day lifespan, which can significantly increase cytosol viscosity. As they age, RBCs undergo changes to their membrane properties and water loss, which increases viscosity. This can lead to a wide range of cytosol viscosities within a single RBC population.
To address this, the study “Viscosity and density measurements on the cytosol of human red blood cells” by John et al., published in the July 15, 2025 issue of Biophysical Journal, combines biophysical techniques to measure not only the average cytosol viscosity, but also how this viscosity varies across RBCs of different ages.
How this study measured density and viscosity
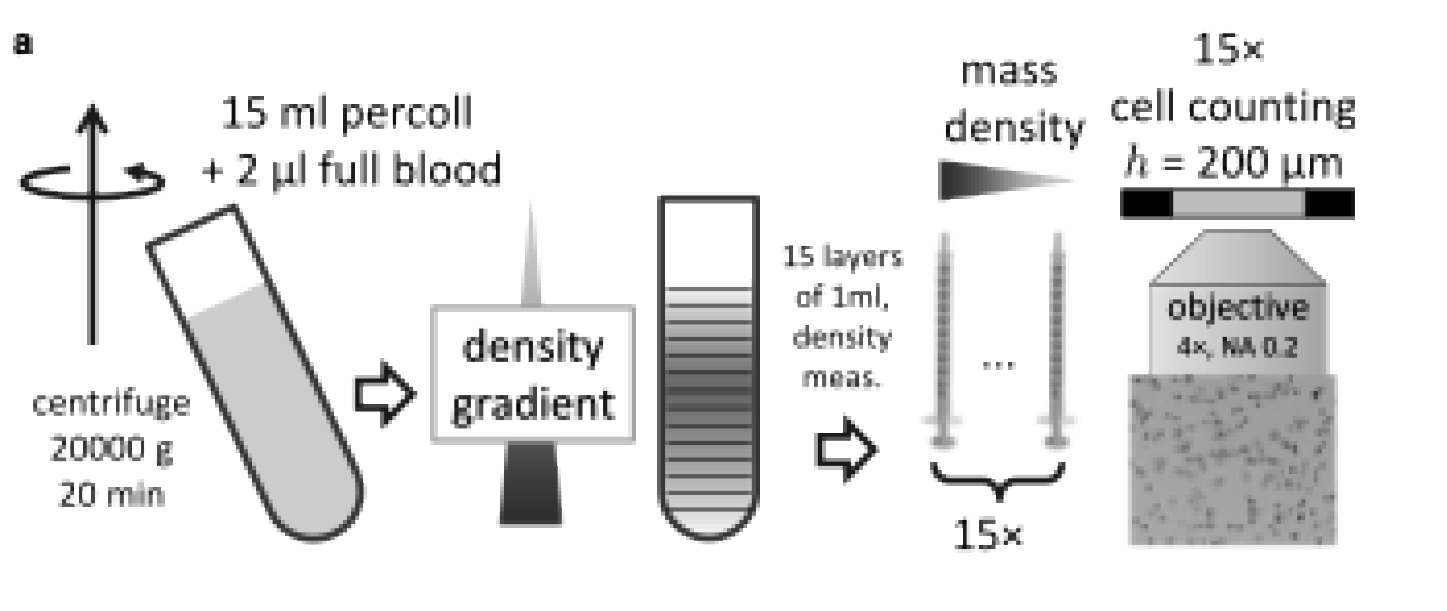
To measure the density distribution of RBCs, John et al. used isopycnic centrifugation and microscopy (Figure 1). Isopycnic centrifugation is a technique that separates cells on the basis of their density. A small droplet of blood obtained by finger puncture was mixed into tubes containing Percoll, a density gradient medium that forms density gradients under gravitational force. After high-speed centrifugation of samples, RBCs settled into distinct layers according to their density. Each layer was then carefully extracted and analyzed to determine its density and cell count.
To measure cytosol viscosity, RBCs were first isolated from fresh blood and thoroughly washed to remove cell components, producing a compact cell pellet. Ultrasound was then used to break up the cell membranes and release the cytosol. After multiple cetrifugation steps to ensure removal of remaining membrane fragments, purified cytosol samples were then used for precise viscosity measurements.

Figure 1: Schematic of method used to determine cell density distribution. A droplet of blood (2 μL) mixed with 15 mL of Percoll is centrifuged at 20,000 × g for 20 min to form a density gradient. Fifteen samples (layers) of 1 mL each are carefully extracted, and both density and cell number are quantified. Figure adapted from John et al. (2025).
Key findings: a viscosity that varies
RBC density distribution
The authors first measured the mass density distribution of RBCs under various osmotic conditions. John et al. found that although the average density of RBCs changes with osmolarity, the spread of densities (σ ≈ 5 mg/cm³) within the cell population remained constant. This spread results from differences between young and old cells. At physiological conditions (290 mOsmol/L, 37°C), the average RBC density was measured to be 1.089 g/cm3.
The viscosity-density relationship
John et al. next measured cytosol viscosities at various degress of dilution and combined these with precise density data. Because cytosol viscosity depends strongly on the concentration of hemoglobin, the authors adapted a previously published semiempirical, hard quasispherical model for the viscosity of hemoglobin solutions. Using only two fitted parameters, they show how viscosity (η) relates to density (ρ), predicting a divergence in viscosity at a density of 1.183 g/cm3.
The viscosity contrast and effects of external factors
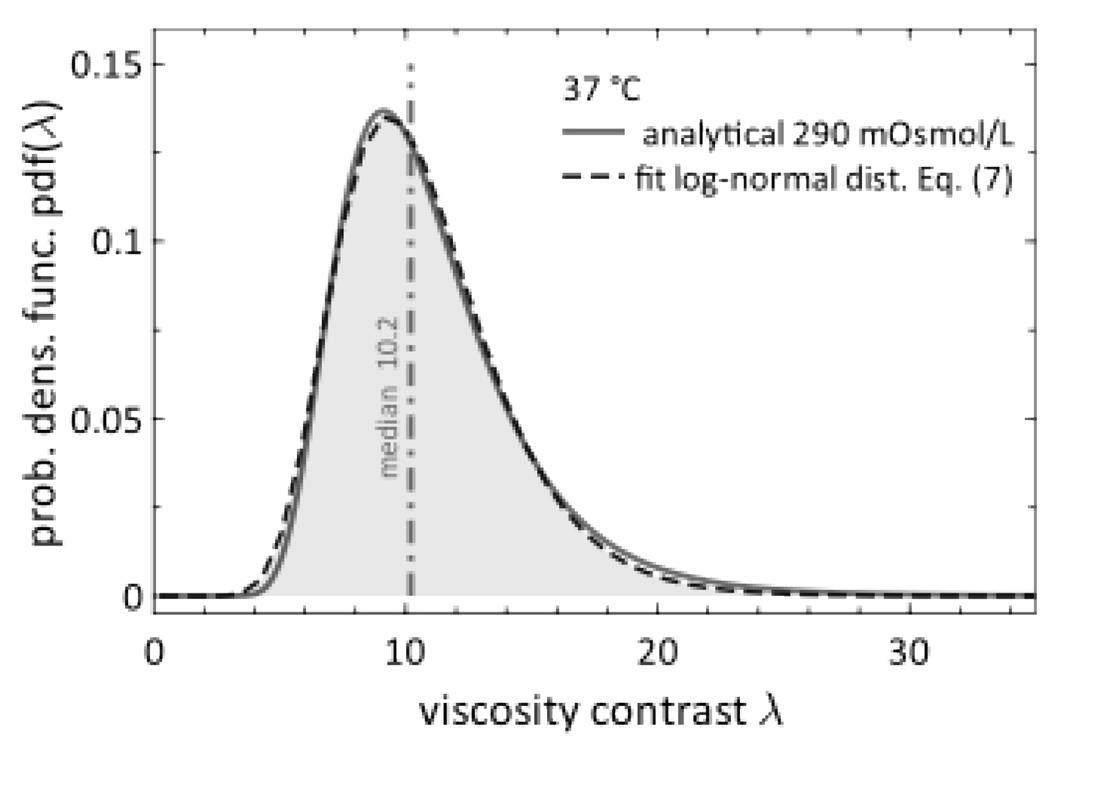
By combining the viscosity-density relationship with the Gaussian distribution of RBC densities, the authors translate their data into viscosity contrast distribution (λ = η/ηplasma), a key parameter for theoretical models of blood flow. This revealed that the cytosol viscosity follows a log-normal distribution (Figure 2), centered around λ = 10 under physiological conditions (290 mOsmol/L and 37°C).
Here, the authors also highlight the role of external factors (temperature and individual variation). A change in temperature from 37°C to room temperature (22°C) increases the plasma viscosity by a factor of 1.4 and cytosol viscosity at mean cell density by a factor of 1.55, resulting in a 10% increase in λ. Furthermore, variations in plasma viscosity between individuals (ranging from 1.1 to 1.5 mPa·s), could also affect λ considerably.

Figure 2: Probability density function of viscosity contrast. Distribution of RBC cytosol viscosity contrast (λ) under physiological conditions (solid red line). The data fit a log-normal distribution (dashed blue line). Figure adapted from John et al. (2025).
Conclusions
In this study, John et al. take us a step closer to accurate predictions of blood flow, which have so far limited our full understanding of red blood cell mechanics. In addition to the elastic properties of the membrane, the authors highlight cytosol viscosity—or viscosity contrast (λ)—as a crucial parameter for any theoretical or numerical model of blood flow. By directly measuring both RBC density distribution and cytosol viscosity and linking these two properties, they show that the λ follows a log-normal distribution with an average around 10—a value that is significantly higher than the simplified λ values previously used in simulations. Importantly, cytosol viscosity is sensitive to external factors like osmolarity, temperature, and individual variability.
By revealing how cytosol viscosity is distributed across an RBC population, this study extends our understanding of both normal cell function and how it is altered in blood diseases. For future simulations of blood flow, John et al. recommend using λ = 10 to more accurately capture RBC mechanics in both health and disease.